Sustainability
Health and Productivity Management
Declaration on Health and Productivity Management
In line with the ANA Group Health Frontier Declaration, the ANA Trading Group places the highest value on the physical and mental health of all our employees and their families.
Human resources are the greatest asset of the trading business and the key to corporate growth is the ability of our employees to work in a healthy and motivating environment.
To achieve our Group mission of “Create diverse value and achieve a wealthy society – to receive the thanks of our customers” , we strive to create a workplace environment in which the human resources supporting our corporate growth are able to maximize their potential and fully engage in their work.
CEO and President, ANA TRADING CO.,LTD.
Junichiro MIYAGAWA
Implementation Structure
In promoting the ANA Group Health Management, employees, the health insurance association, and the Group companies work together as one. In addition to appointing an ANA Holdings Inc. executive as the Chief Wellness Officer (CWO) responsible for promoting health management within the ANA Group, each Group company has appointed a Wellness Leader (WL).
The Group’s health management policies, promotion status, and issues are discussed and reported to the Group Corporate Strategy Committee, which is attended by Members of the Board, and important matters are reported to the Board of Directors.
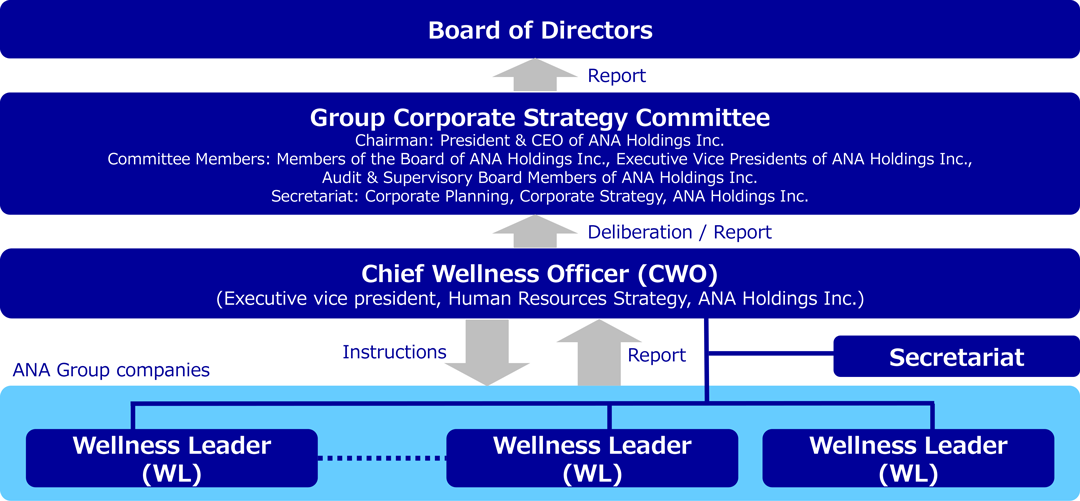
As part of these efforts, at All Nippon Airways Trading Co., Ltd., the Wellness Leader reports to the CEO & President and the executive vice president in charge.
The relevant parties work closely together to promote various health promotion measures based on an accurate understanding of the situation related to employee health.
In addition, we actively communicate our various initiatives not only through internal discussions but also through lectures on health management and our company website.
In developing occupational health and safety measures, we ensure compliance with laws, regulations, and collective agreements. To assess the current situation, we rely primarily on the Health and Safety Committee and employee representatives and discuss issues at all relevant levels.
In addition, we are working on employee health management in cooperation with insurers, such as the health insurance association, and the ANA Tokyo Group Health Management Office to manage the day-to-day health of our employees.
Our system identifies workplace risks, defines their level of urgency, and prioritizes them to implement effective initiatives, including risk countermeasures.
Health Management Strategy Map
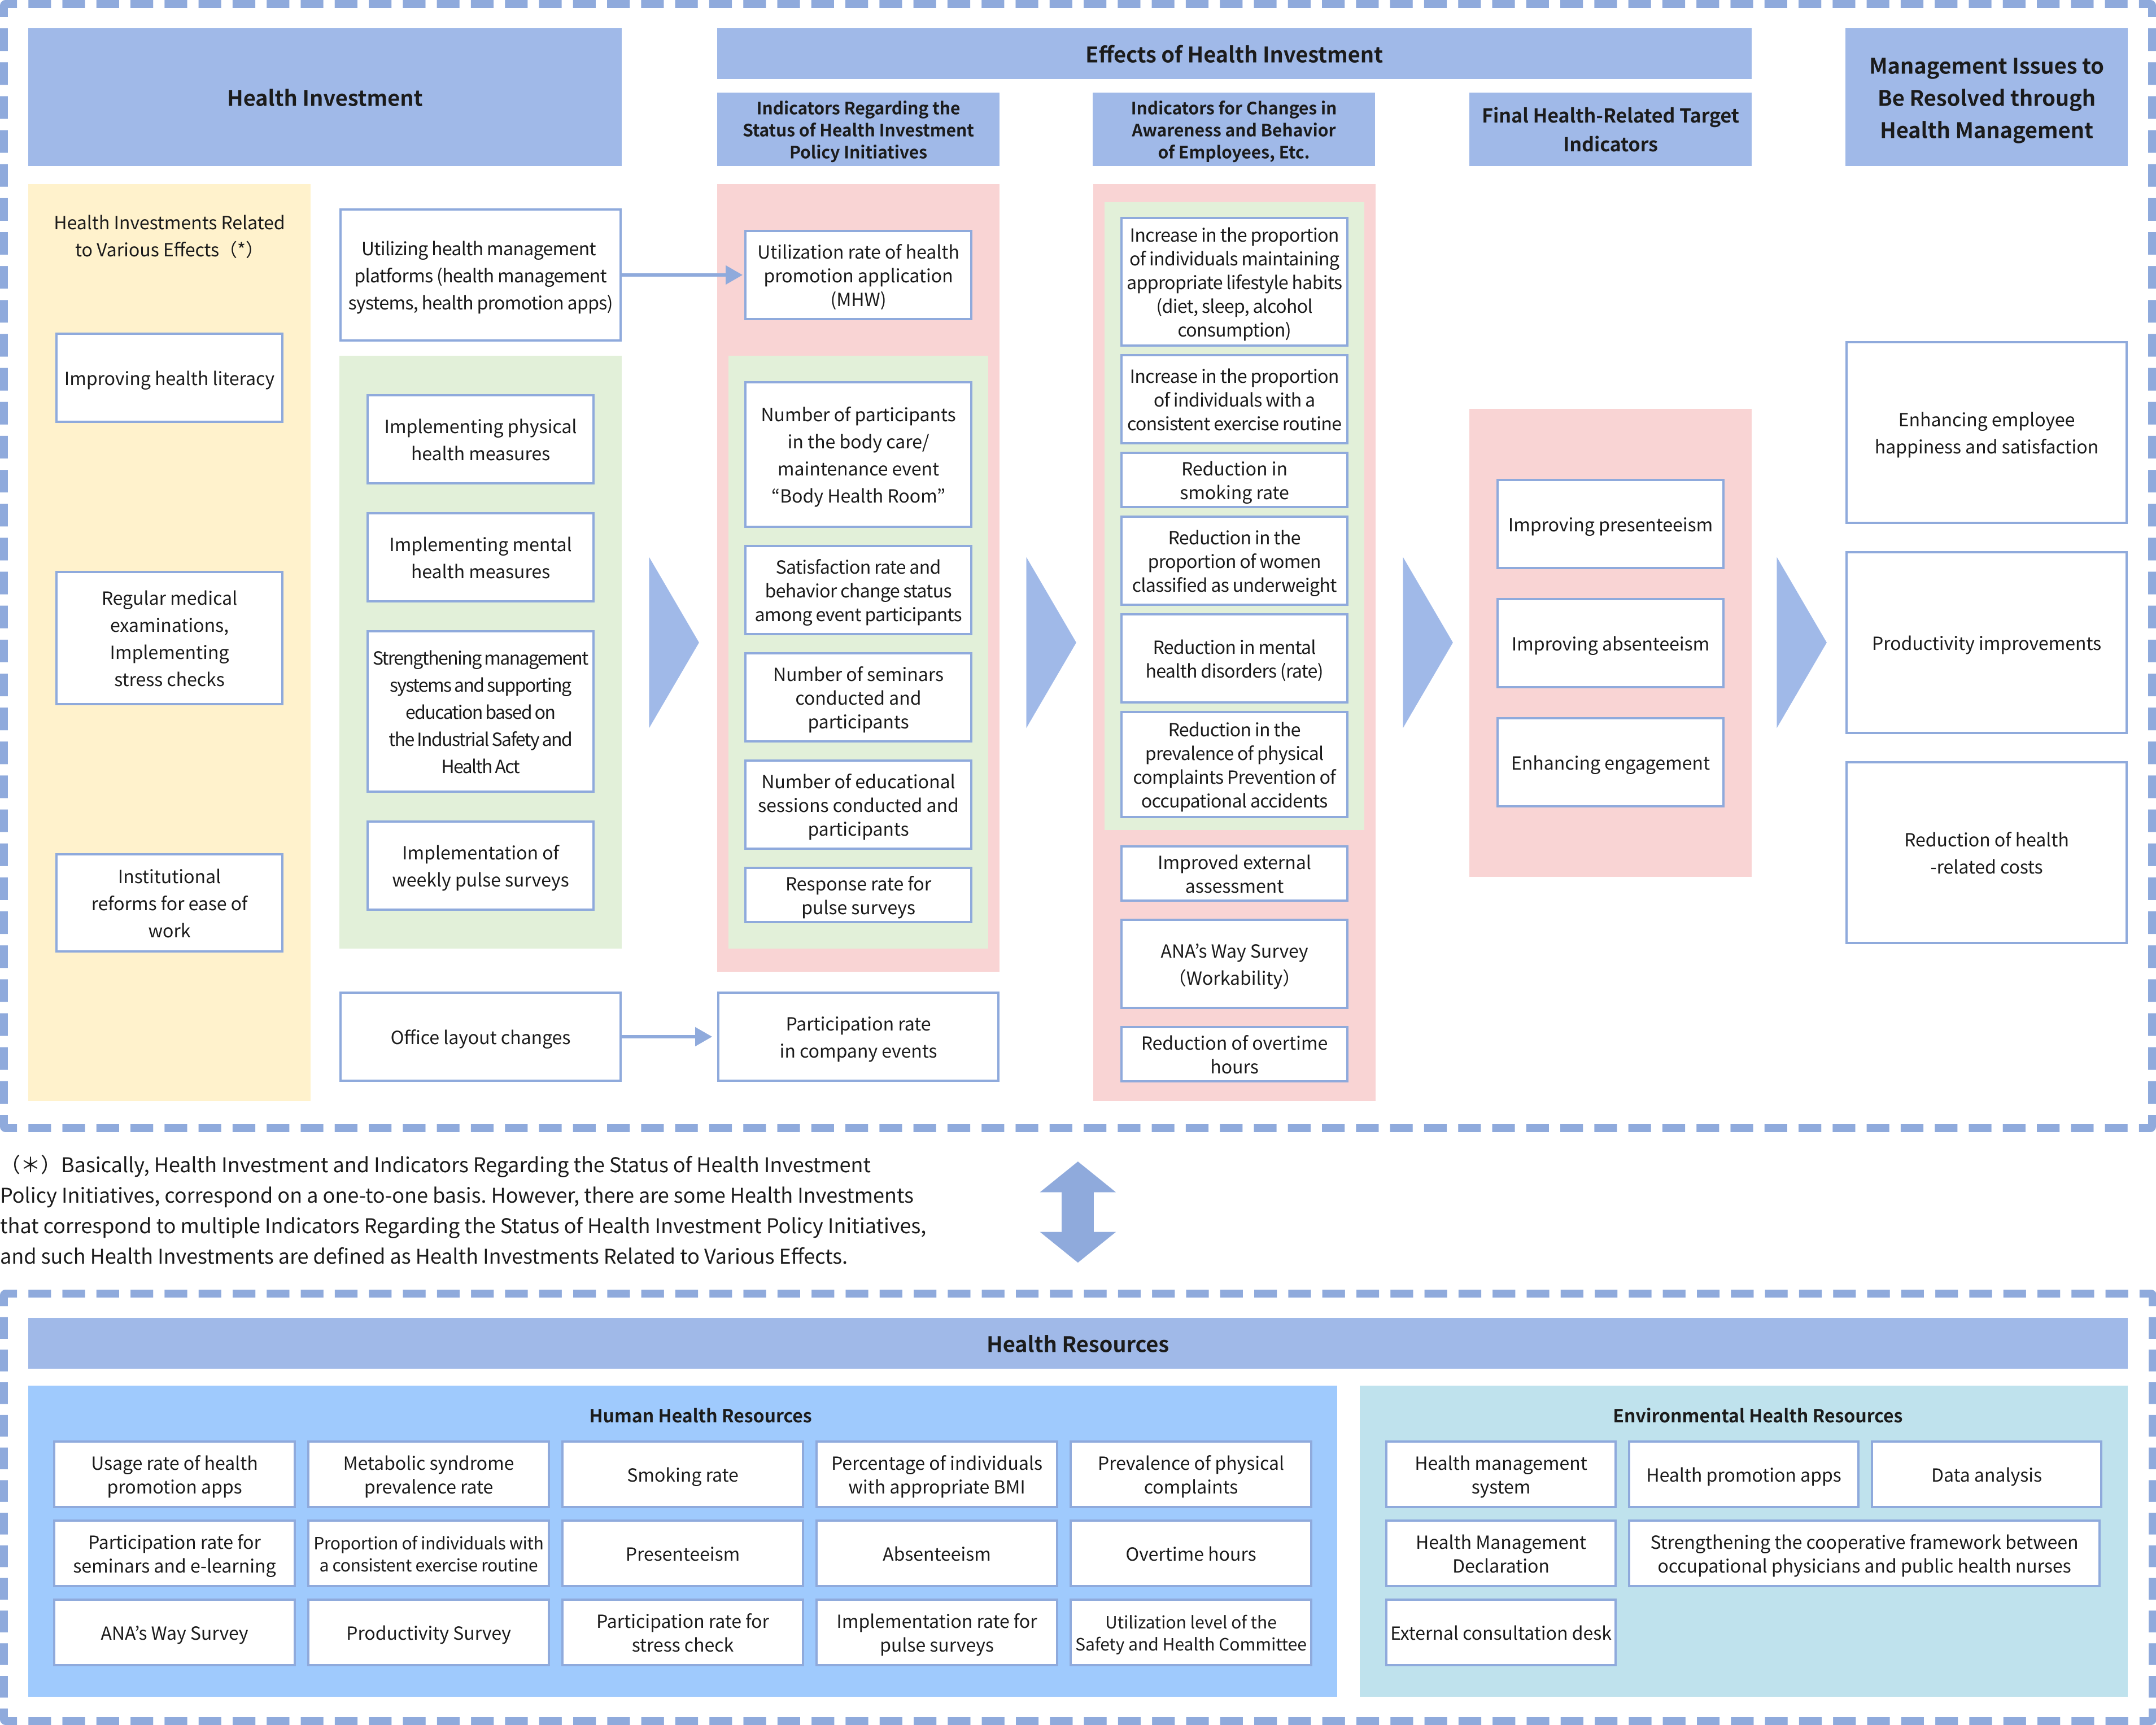
In our business as a trading company which is responsible for diversified businesses in the ANA Group, our greatest asset is our human resources.
When each and every employee is healthy, highly motivated, and energetically working to the best of their ability, originality, flexibility, and foresight are nurtured, and this will contribute to the realization of an affluent society and enhancing corporate value.
Target and KPIs
| ANA Group’s common management challenges | KPIs for solving issues | ||
|---|---|---|---|
| Analytical indicators at ANA TRADING | FY2024 | Target values by FY2030 | |
| Enhancing employee happiness (EH) and employee satisfaction (ES) | (i) Health-related items in ANA’s Way Survey |
|
ANA TRADING consistently tends to score high marks, so we will maintain a margin of ±0.15 from the current score to ensure there is no statistical difference. |
| (ii) Increasing the implementation rate for pulse surveys | The average response rate is around 25%. | Improving the response rate to exceed 50% consistently | |
| Productivity improvements | (iii) Results of the periodic health checkups | Results of initiatives: Refer to 2. Employee Health Status | |
| (iv) Stress check (percentage of individuals with high stress) | 4.91% | Maintain at 5% or less of those undergoing stress checks | |
| (v) Rate of participation in e-learning course related to health management | 22 people (just under 5%) | Over 50% | |
| Reduction of health-related costs | (vi) Status of productivity decline due to presenteeism | 16% (1,103,000 yen per person) |
12% (800,000 yen per person) or less *Company-wide cost reduction equivalent to approximately 100 million yen/year |
Major initiatives
- Regular health exams (Taken by 100% of employees in FY2023)
- Stress checks (Taken by 87.2% of employees in FY2023)
- Hold events and campaigns to stimulate communication between employees
- In-house body care and massage booths: 136 participants(FY2023)
- Use health management apps
- Stimulate organization using talent management system
- Strengthen safety and hygiene activities
FY2024 Results
| Implemented measures | FY2024 results |
|---|---|
| Periodic health checkups | FY2024 participation rate: 100% (FY2023: 100%) |
| Stress check | Participation rate: 87.2%, Percentage of individuals with high stress: 4.91% (FY2023: 94.2%, Percentage of individuals with high stress: 5.29%) |
| Event to encourage employee communication | |
| Group company and business division exchange event: “What’s Up?” | Total participants: 440 |
| Bukatsu (extracurricular activities) festival | Participants:32 |
| Athlete Lab | Participants:80 |
| Health-related events | |
| Lung health check | Participants:77 |
| AED usage training | Participants:28 |
| Heatstroke prevention seminar | Participants:16 |
| Body care/maintenance event | Participants: 148 (FY2023: 136) / Investment amount: approximately 700,000 yen Note: More than 80% achieved maximum scores on satisfaction indicators, and over 95% showed a change in health awareness and attitudes. |
| Walking event “WalkFES” | Participants:73 |
| Health literacy education | |
| Training for organization leaders | Participants:141/Investment amount: approximately 500,000 yen |
| Seminar (women’s health issues, etc.) | |
| e-learning | Number of courses delivered: 10 |
| Regular installation of Office Nuts | Investment amount: approximately 250,000 yen |
| Health management app (MHW) utilization | Number of logins: 93 |
| Organizational activation through talent management system utilization | Investment amount: approximately 4 million yen |
| Enhancing safety and health activities | |
Results of the initiatives
To promote the ANA Group Health and Productivity Management, we set indicators based on issues and apply the PDCA to improve these indicators. Data on health-related costs, such as absenteeism*1 and presenteeism*2, are analyzed to assess the impact of the initiatives on management.
- 1. Absenteeism is a condition in which an individual has ill health or a mental health condition that causes them to miss work, take leave, arrive late, or leave early.
- 2. Presenteeism is a condition in which employees attend work but perform poorly due to ill health or a mental health condition.
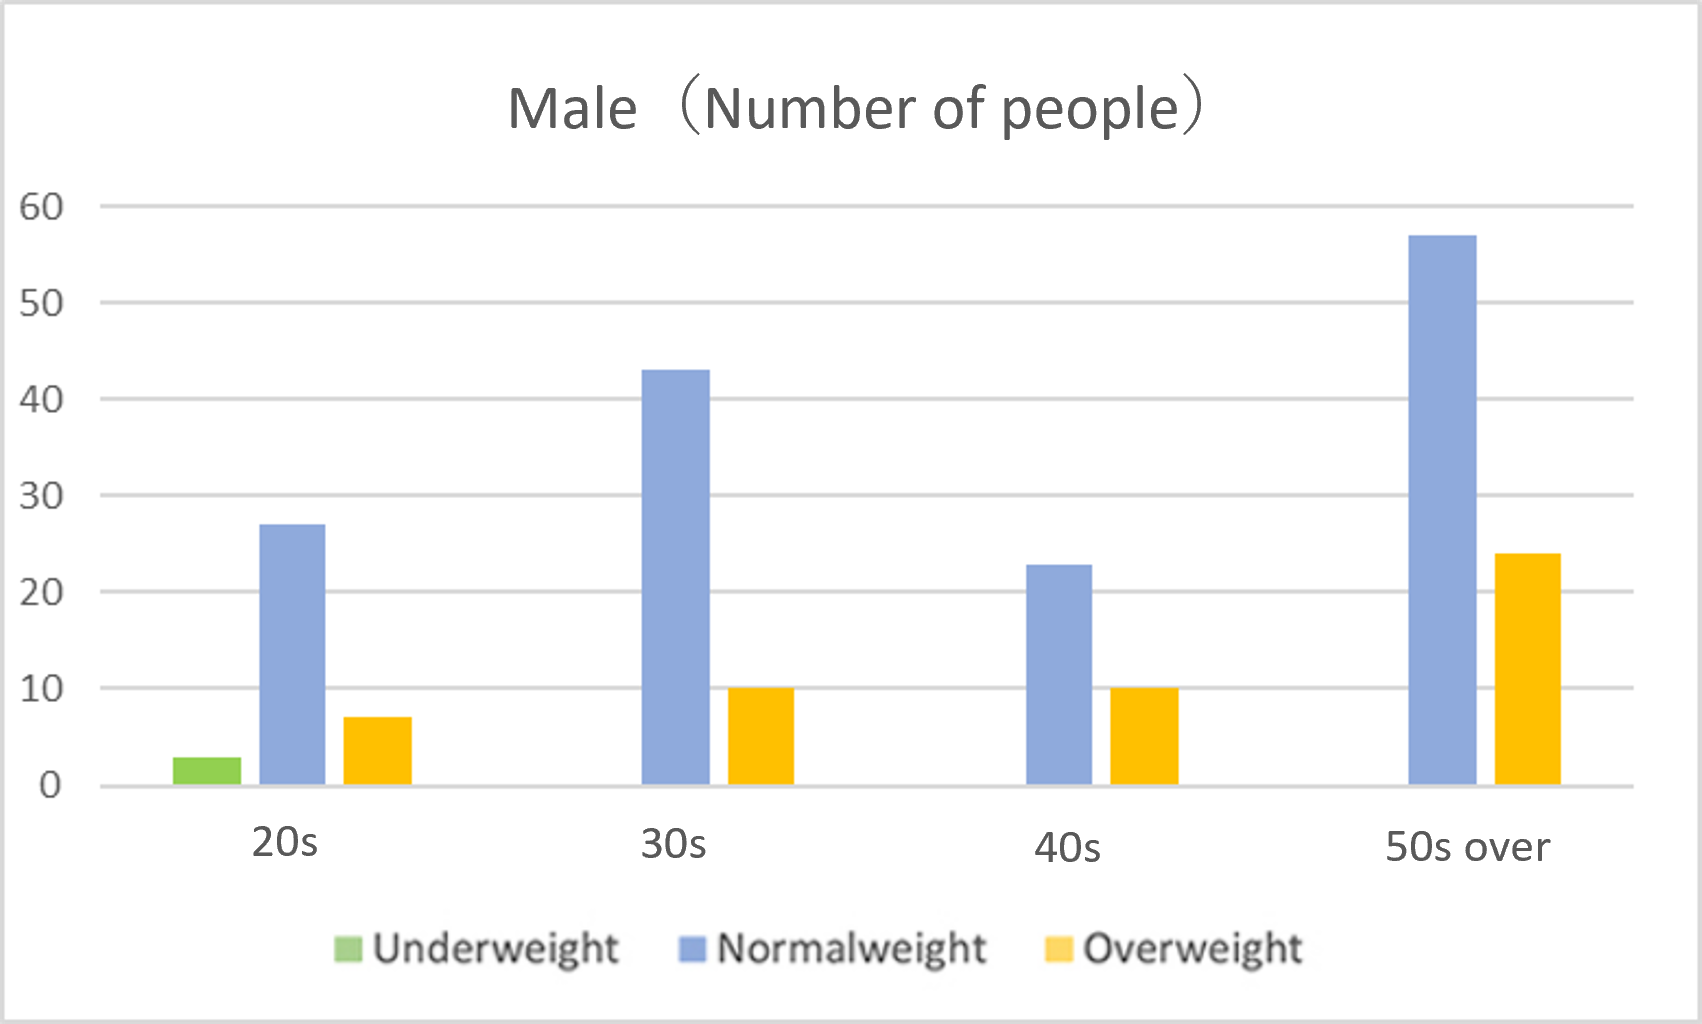
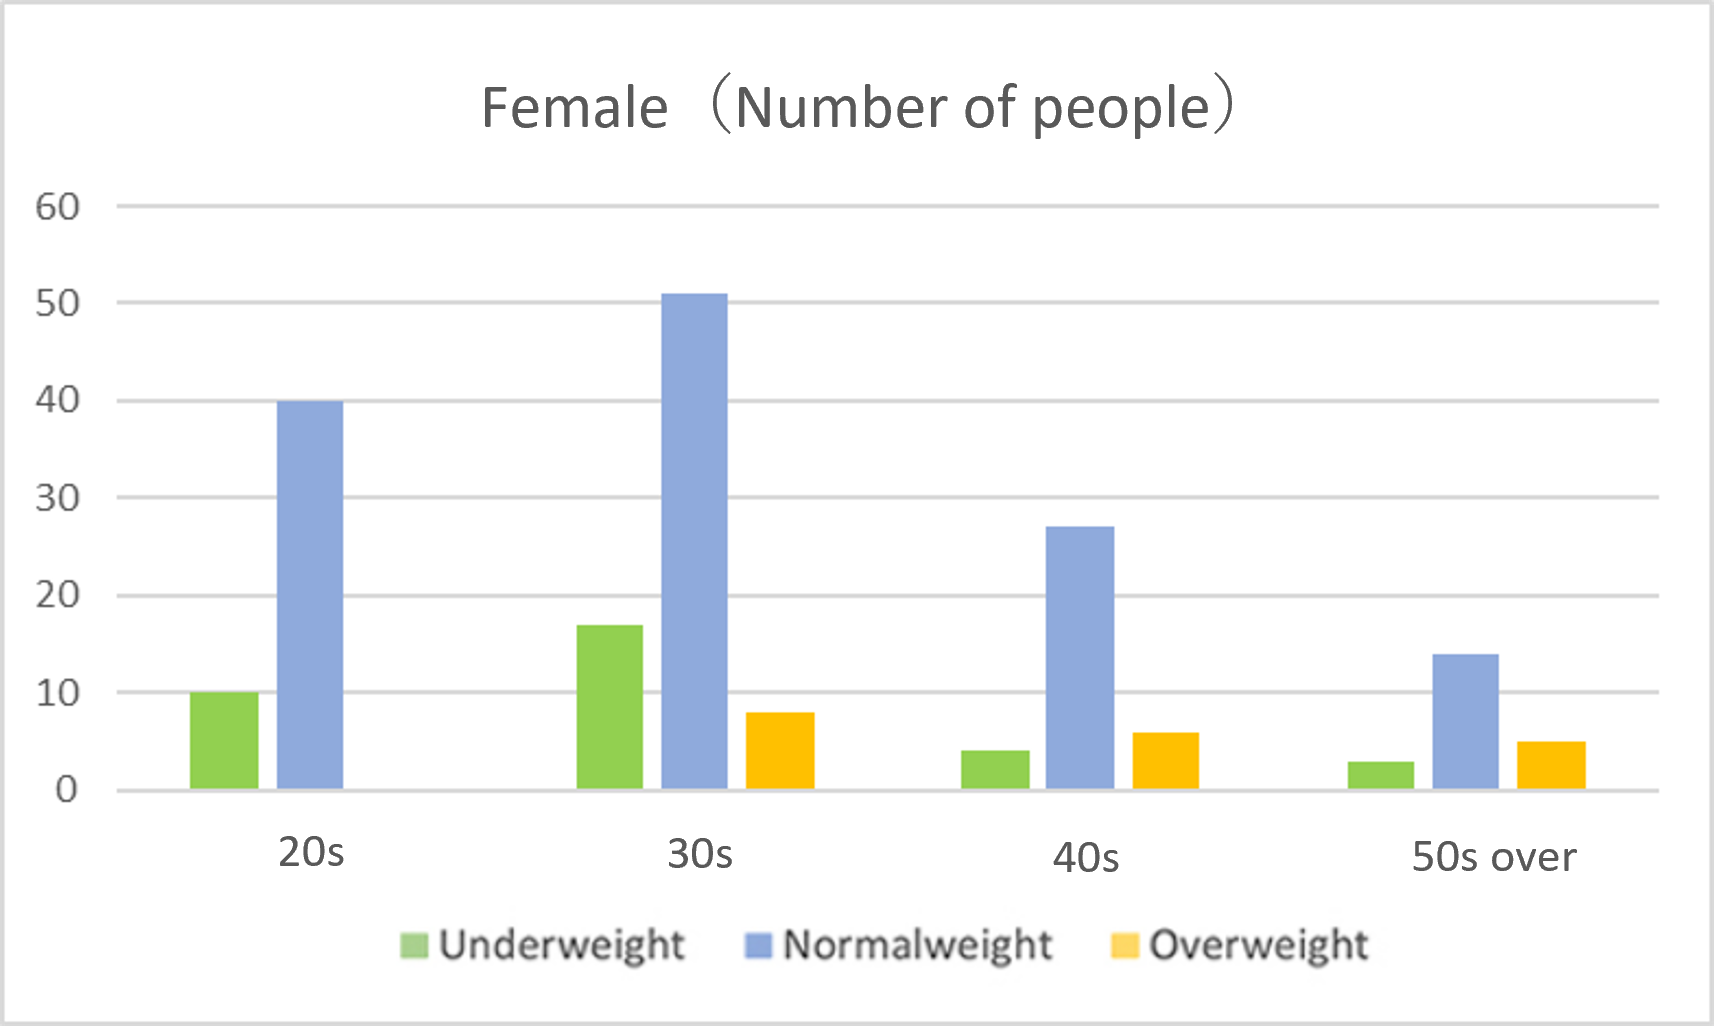
1. Employee health challenges
BMI distribution
Smoking
(FY2023: Men 27.0%, Women 1.6%; FY2024: Men 28.4%, Women 2.3%)
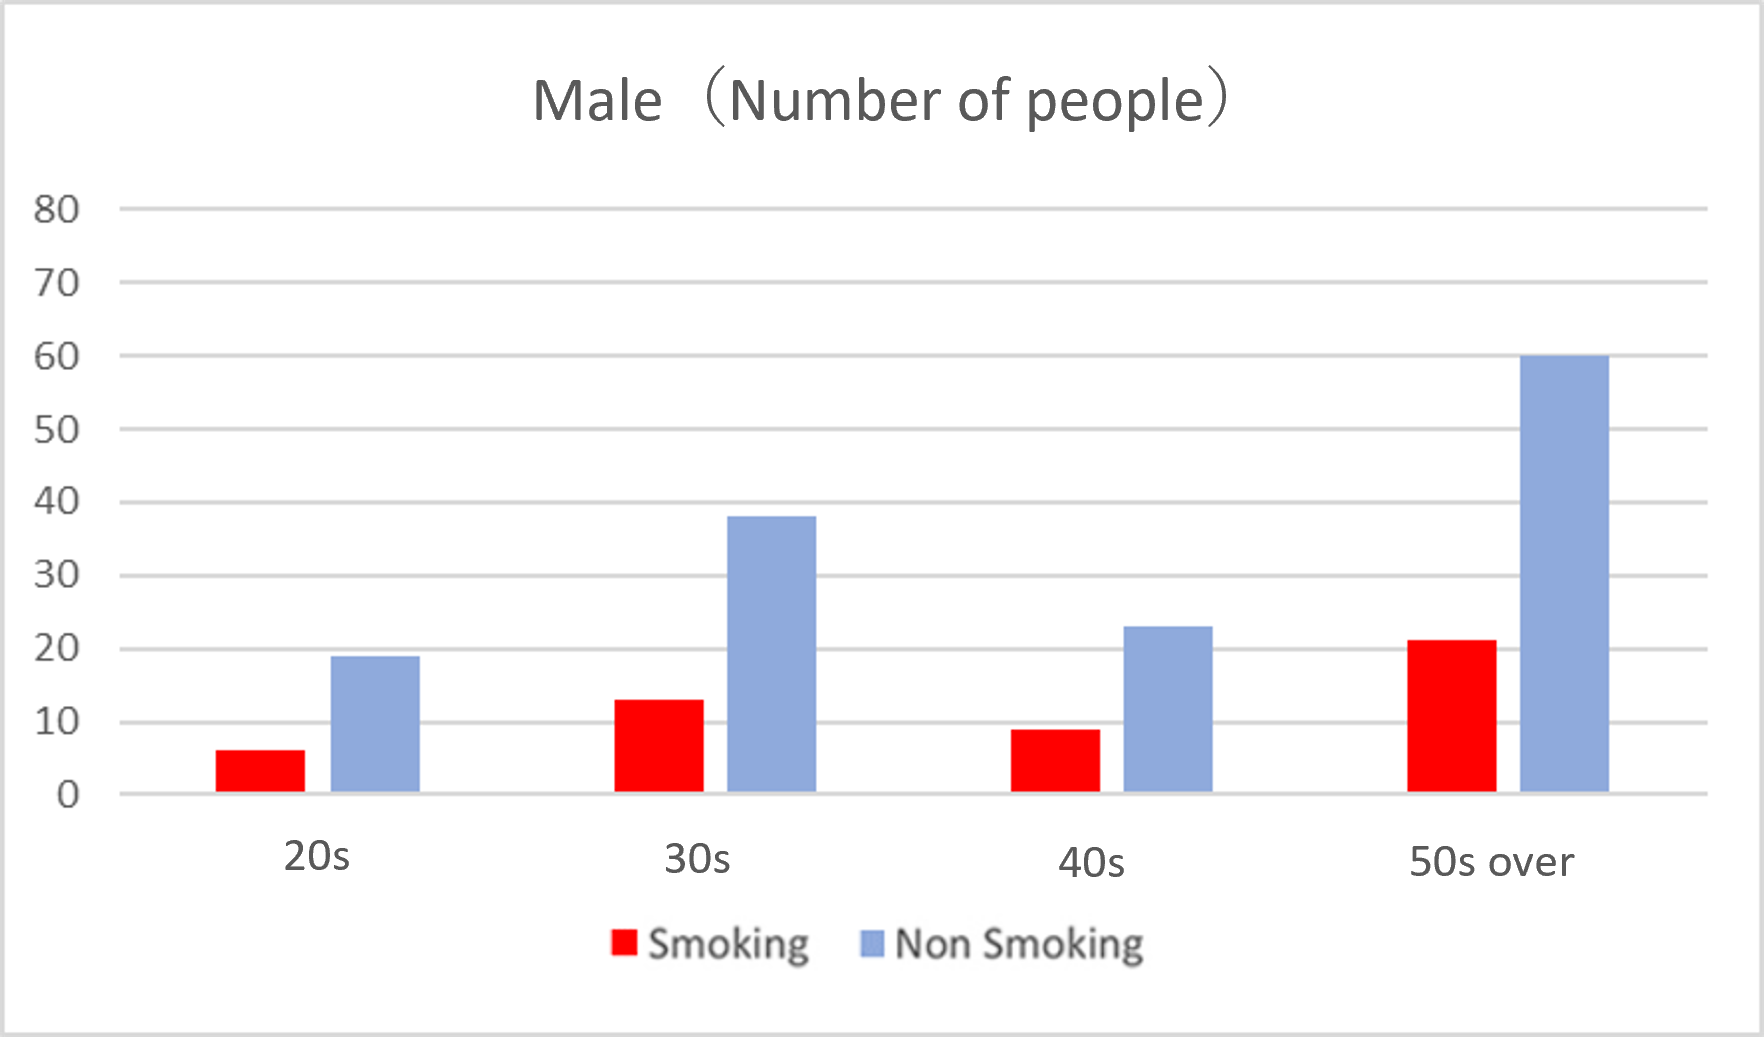
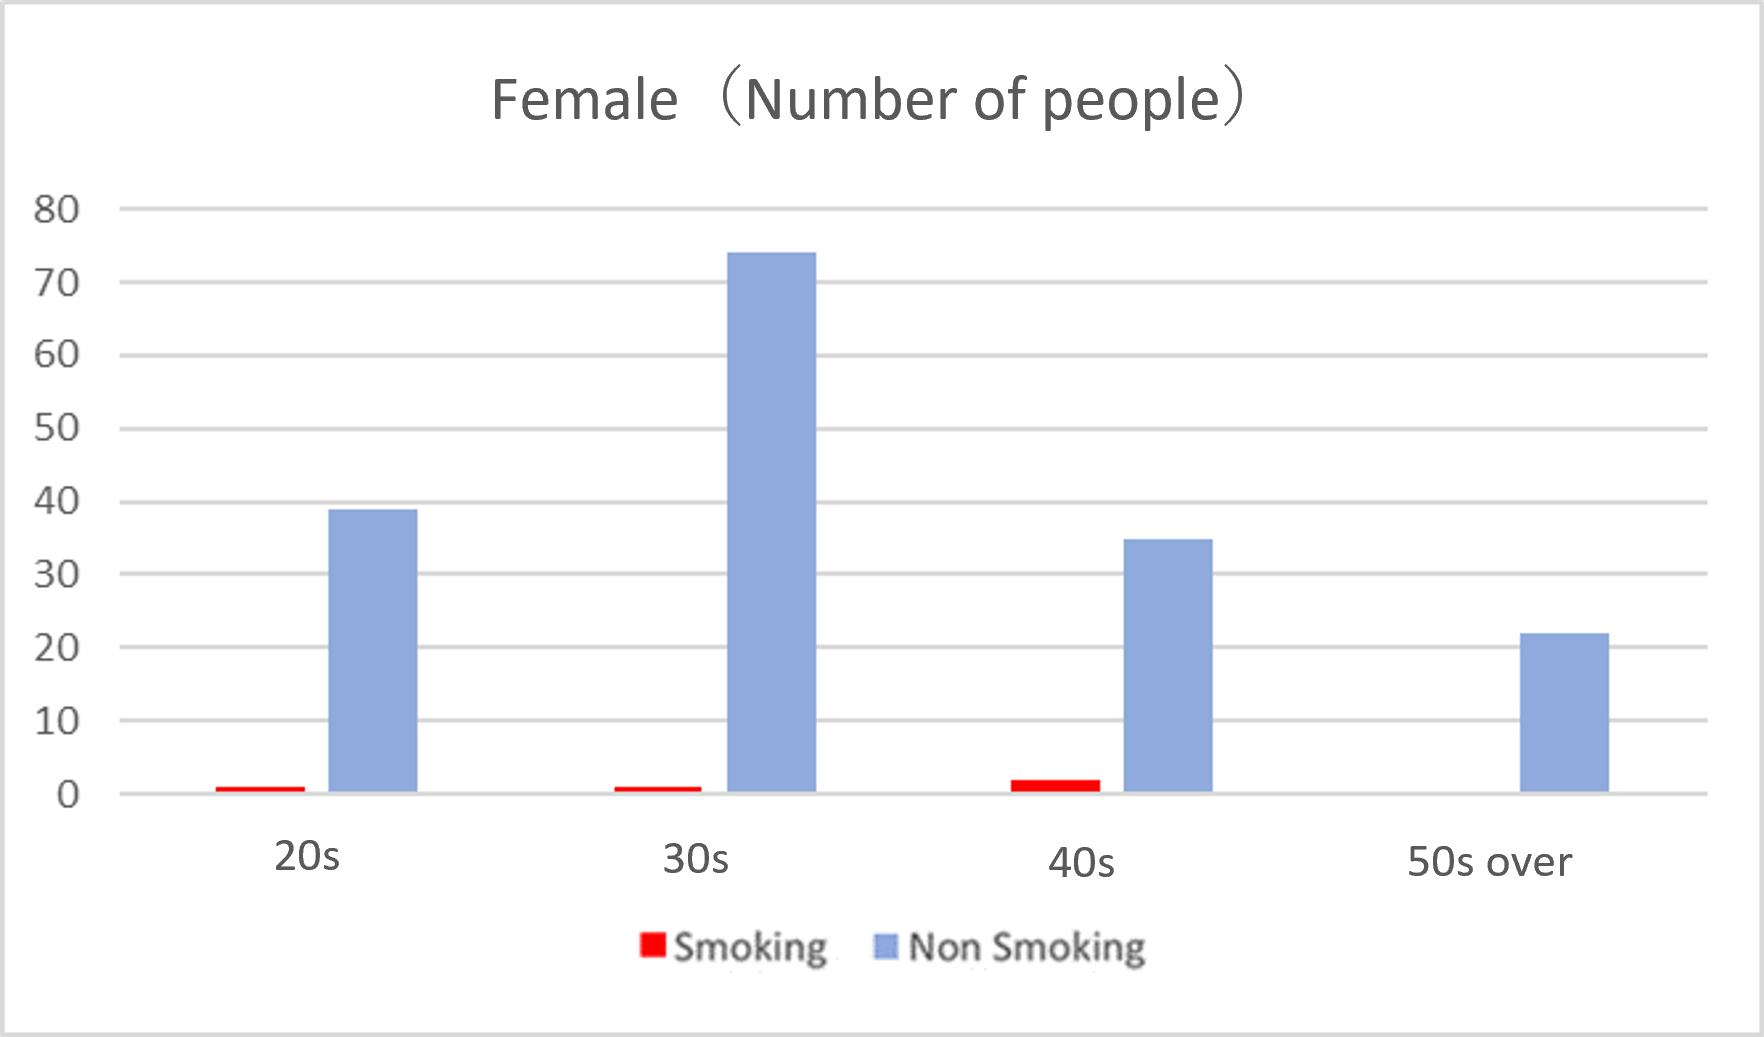
Given the above, we have established indicators related to BMI, smoking rate, and metabolic syndrome, and also aim to improve employees’ mental health condition. We also established an indicator based on the number of ailment complaints identified from stress checks. These four indicators have been defined as health management benchmarks.
2. Employee health status
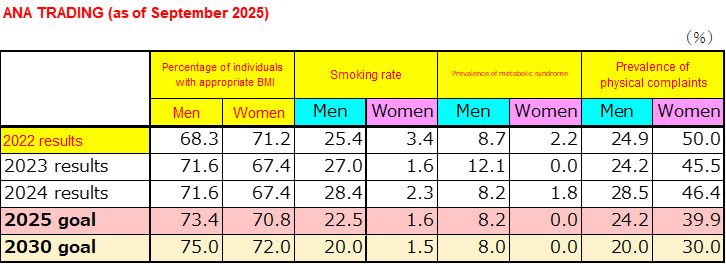
- Ratio of employees with appropriate BMI: Ratio of people applicable to 18.5 ≤ BMI* < 25
- BMI = weight (kg) / height (m)2
- Smoking ratio: Ratio of people who smoke
- Metabolic syndrome ratio: Ratio of people age 40 and over applicable to standards for definition of metabolic syndrome
- Applicable to standards: Applicable to waist size standards (Male: 85 cm or larger; Female: 90 cm or larger), and has two or more other risks from blood sugar, body fat, and blood pressure
- Ailment complaint ratio: Ratio of people with three or more ailment complaints*
- Ailment complaint: Symptoms of physical discomfort: (E.g.) Back pain, eye fatigue, stomach discomfort, etc.
- Reception rate of detailed examination after regular health checkups:
52.6%
3. Number of occupational accidents:
FY2024
Workplace accidents: 1
Commuting accidents: 0
4. Average years of service
FY2024: 15.8 years
5. Working hours status
FY2024 company-wide average overtime: 10.2 hours per month
6. Rate of paid leave utilization
FY2024: 52.6%
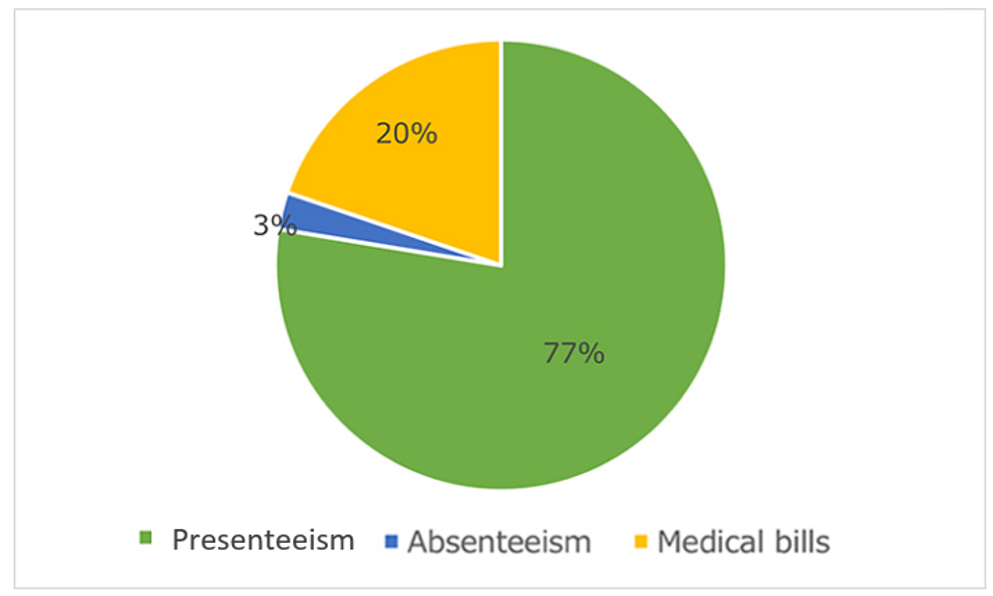
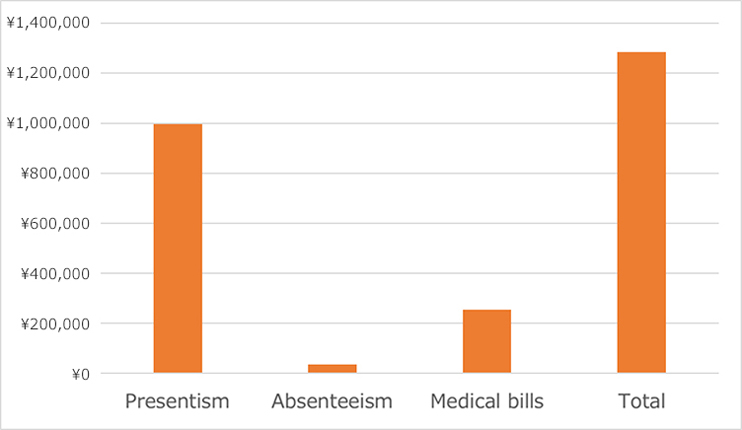
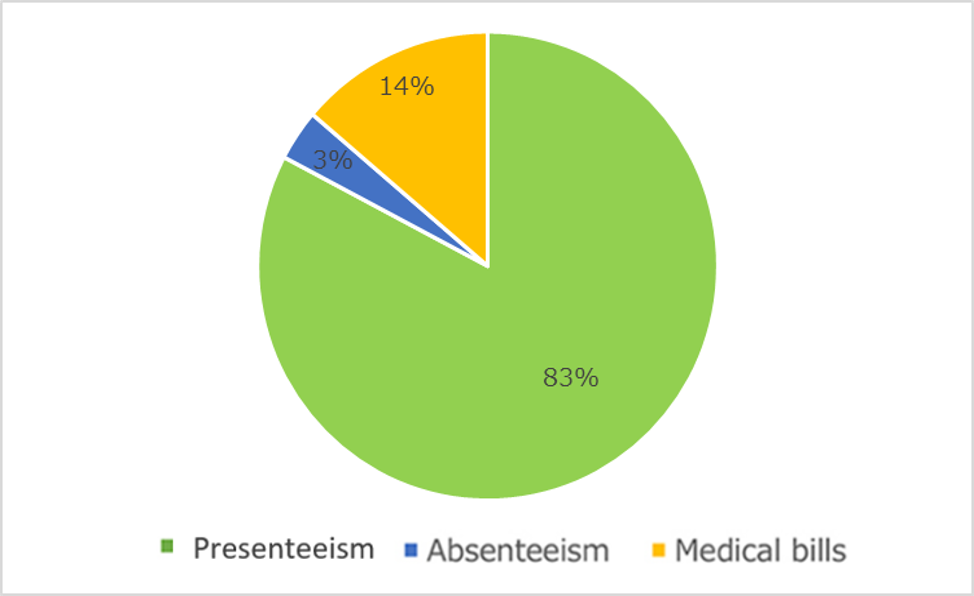
7. Loss/impact due to health conditions
Most health-related costs are due to presenteeism (i.e., lost employee productivity).
Per-capita health-related costs are shown in the graph below.
[FY2023]
[FY2024]
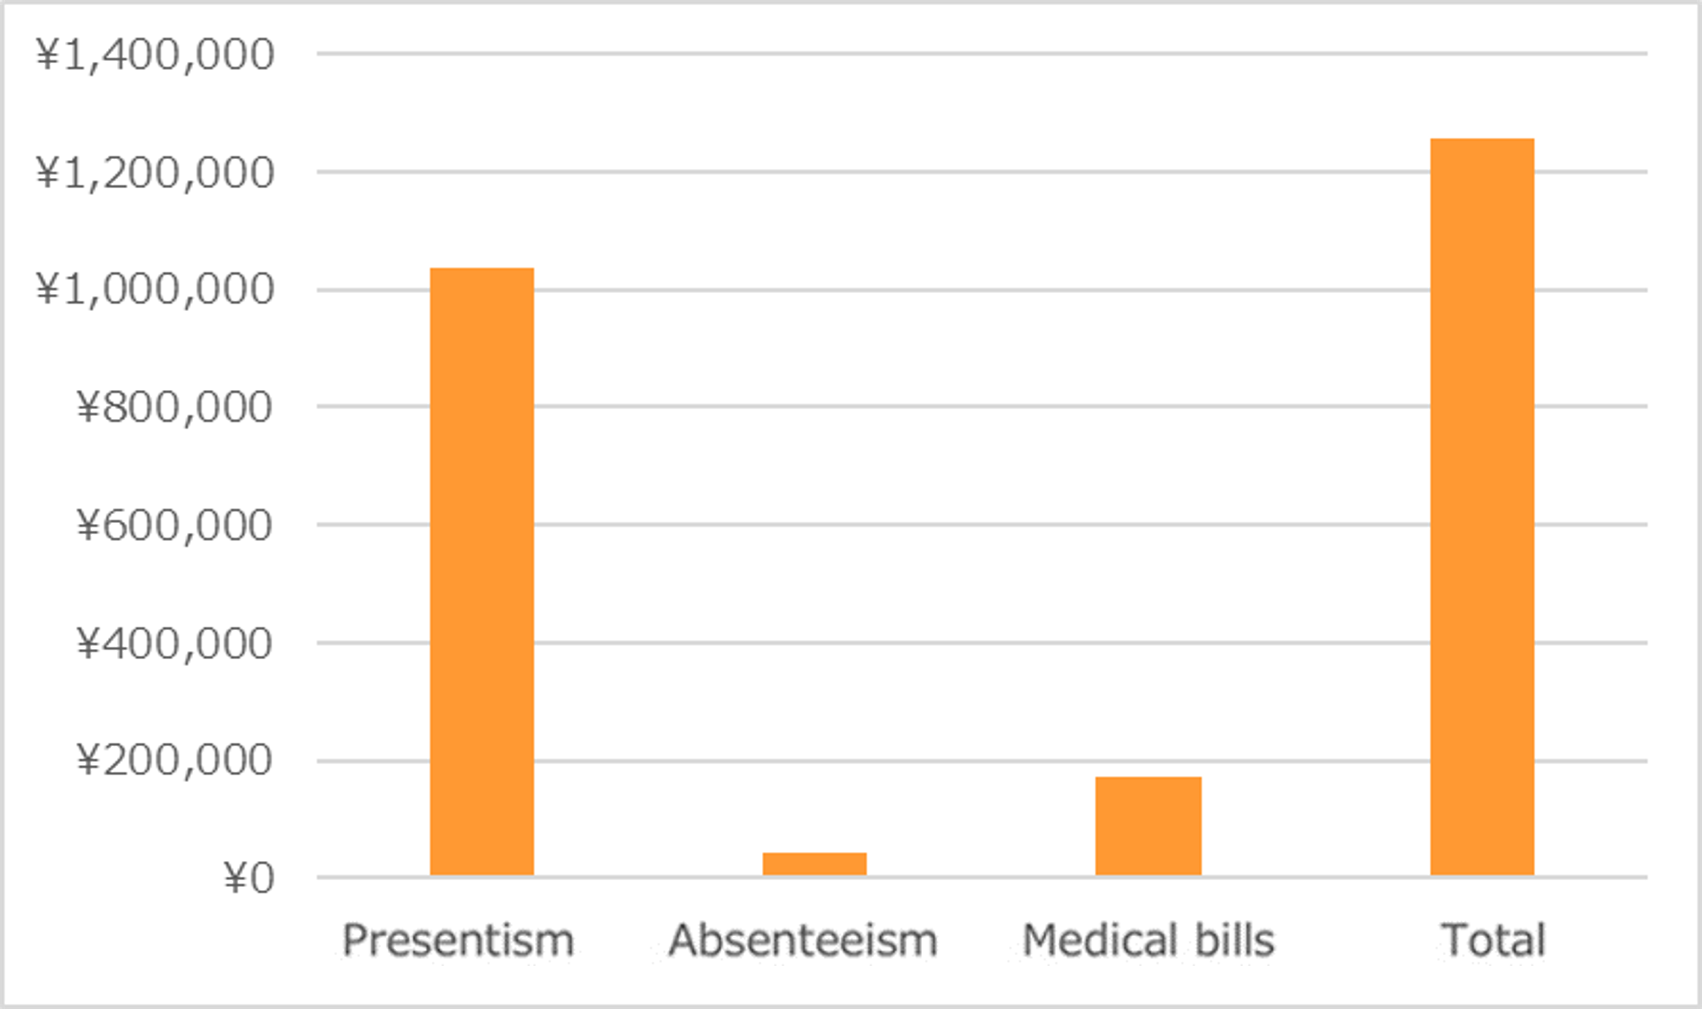
- Numbers are calculated based on the respondents (351) who answered both absenteeism and presenteeism questions in the questionnaire.
- The medical expenses are calculated from the data on the statement of medical expenses.
- Presenteeism = [Percentage of presenteeism loss] x [FY2023 per capita annual income (salary & bonus)]
- Absenteeism = [Absenteeism (number of days)] x [FY2023 per capita daily income (annual income divided by 365 days)]
External evaluation
FY2024 Certified Health and Productivity Management Organization 2025 (Large Enterprise Division)~White 500~, conducted by Nippon Kenko Kaigi
FY2023 Certified Health and Productivity Management Organization 2024 (Large Enterprise Division)~White 500~, conducted by Nippon Kenko Kaigi
FY2022 Certified Health and Productivity Management Organization 2023 (Large Enterprise Division)~White 500~, conducted by Nippon Kenko Kaigi
FY2021 Certified Health and Productivity Management Organization 2022 (Large Enterprise Division)~White 500~, conducted by Nippon Kenko Kaigi
FY2020 Certified Health and Productivity Management Organization 2021 (Large Enterprise Division), conducted by Nippon Kenko Kaigi
FY2019 Certified Health and Productivity Management Organization 2020(Large Enterprise Division), conducted by Nippon Kenko Kaigi
ANA’s Way Survey (ANA Group Employee Awareness Survey)
The ANA Group Employee Engagement Survey (ANA’s Way Survey) is conducted annually to improve employee satisfaction (ES) and engagement by using fixed-point observation, analysis, and enhancements to employees’ attitudes toward their work and workplace satisfaction. It also aims to improve customer satisfaction and corporate value. In fiscal year 2023, 356 employees from ANA TRADING participated in the survey, resulting in a response rate of 98.3%. The overall score remained high at 4.18, as in the previous year (ANA Group average: 3.94). Notably, since the COVID-19 pandemic, there has been an upward trend in scores for employees’ pride in their work.
In fiscal year 2024, 350 employees from ANA TRADING participated in the survey, resulting in a response rate of 96.7%. The overall score reached an impressive 4.20, surpassing the ANA Group average of 3.98. The primary increase in scores was observed in questions related to corporate culture, likely attributable to enhanced communication stemming from more frequent face-to-face interactions.
Following the survey, ANA TRADING distributed reports on results by company and department. We then analyzed the root causes and used the findings to develop action plans and improve communication within each workplace.
We believe that when our employees work with brightness, energy, and vitality, it contributes to corporate growth and customer satisfaction. We will continue our efforts to make ANA Group a rewarding place to work.